![]()
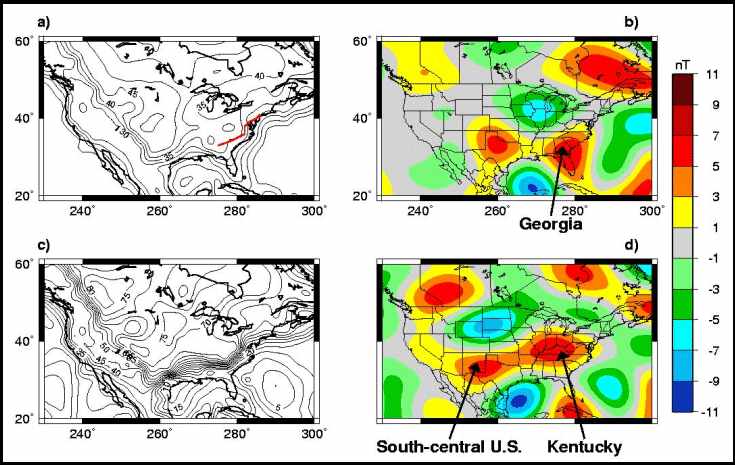
(a) Magnetic crustal thickness from induced magnetization model. Red line shows boundary between magnetic rocks of the craton and non-magnetic sediments of the coastal plain. (b) Magnetic field from (a) with remanent magnetizations included. (c) Vertically integrated magnetization model (shown also at right). (d) Magnetic field model from 2c.
Vertically integrated magnetization model (induced and remanent) which explains satellite observations. The long-wavelength anomaly contrast is an edge effect due to the difference in thickness between continental (35 km) and oceanic 12 km) crust. This model differs significantly from those inverted from magnetic field data alone, and is improved through the use of geologic constraints.
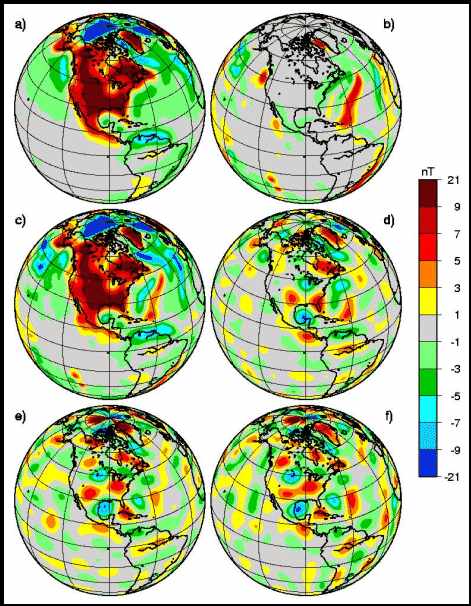
A model of global crustal magnetic anomalies is derived from a total field model including induced and remanent magnetization as follows: (a) Modeled global magnetic field (all harmonics) due to induced magnetization only for an assumed thickness-susceptibility model of the continental and ocean crust. Thickness comes from a global seismic tomography model. Tectonic province designations are used to locate the Curie isotherm; magnetic layer thickness is taken to be that above the Curie isotherm, assuming susceptibility for magnetite as the magnetic mineral. (b) Modeled global magnetic field due only to remanent magnetization in oceanic crust (all harmonics) from non-satellite paleo-latitude direction and age-dependent intensity variation data. (c) Modeled global magnetic field due to combined induced (a) and remanent (b) magnetizations (all harmonics). (d) Induced and remanent magnetization model for degrees 15 through 26 (crustal features). (e) Magnetic field measured by Magsat for degrees 15-26. (f) Magnetic field measured by Oersted for degrees 15 and 26. All are shown at 400 km altitude.
Contact: Mike Purucker, GSFC, Code 921 (purucker@geomag.gsfc.nasa.gov)
![]()
 Back to Geodynamics Science Highlights
Responsible NASA official: Dr. Herbert Frey