Both
model and observations are restricted
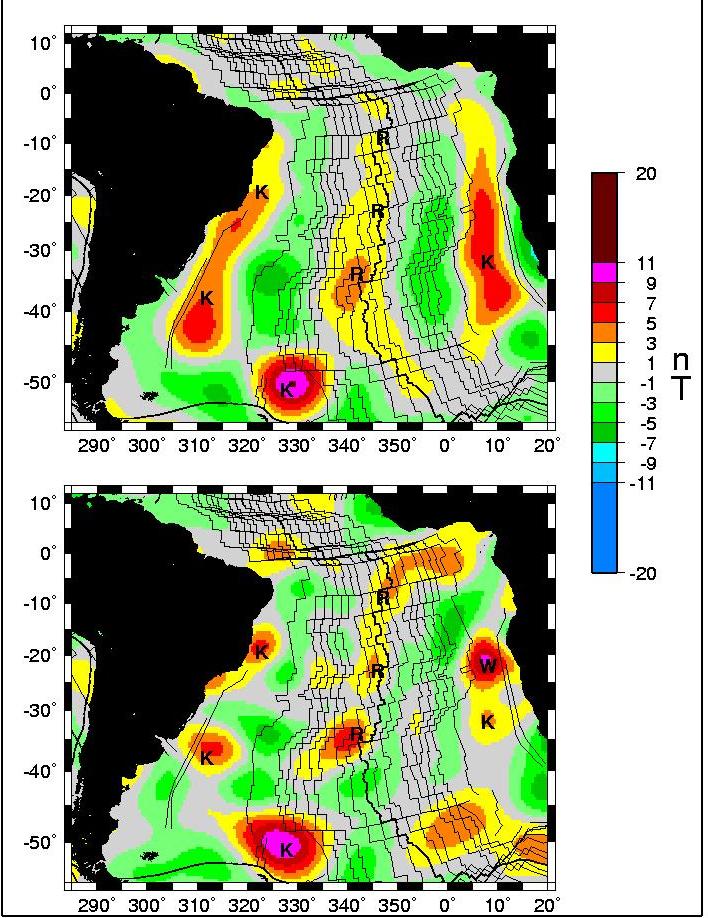
to the spectral range 15-40 and are displayed at an altitude 400
km. Sea floor spreading isochrons are shown as solid black.
Lines in the Atlantic and the mid-Atlantic ridge is shown as a thick
black line. K identifies anomalies due to the Cretaceous Quiet Zone. R
identifies anomalies due to the ridge axis, W identifies Walvis
ridge anomaly(Purucker and Dyment, 2000).
