Patrick Taylor
Satellite Altitude Magnetic Anomaly Study of the Kiruna, Sweden Iron-Ore
Deposit
Previous studies of satellite altitude (~400 km) crustal magnetic data, mainly from the Magsat
mission, have revealed several significant (>15 nT) anomalies over known ore bodies in Russia , the
United States and the Central African Republic. Additional satellite data is now available from the
Danish Oersted satellite, and is becoming available from the newly launched German CHAMP
mission. We recently investigated another of the world's largest known iron ore deposits in the area
around Kiruna, Sweden, by looking at the relationship between satellite-altitude magnetic and
aeromagnetic data of northern Sweden and the regional geology/tectonics of the Kiruna iron ore
district. Figure 1 compares the satellite-elevation crustal anomaly field from Magsat with
aeromagnetic data from the NORDKALOTT (Unified study by geological surveys of Norway,
Sweden and Finland) upward continued to the same altitude.
In the Magsat map (Figure 1A) the marine regions surrounding Norway are represented by
predominately negative anomalies. The land area is dominated by a positive bulls-eye anomaly (the
Kiruna anomaly) with a maximum value (>9 nT) centered 67 deg. N latitude and 20 deg. E
longitudes near the city of Kiruna, Sweden. Extensive aeromagnetic surveying has been done across
this region and these extremely detailed magnetic data reveal a concentration of high near-surface
anomaly values (>6000 nT). The Kiruna region is the center of a complex nexus of magnetic
highs. The mathematically upward-continued aeromagnetic data (Figure 1B) shows these
NORDKALOTT data at 400 km altitude have virtually the same anomaly pattern as the Magsat
map. It is particularly noteworthy that the positive magnetic anomalies in both the satellite and
upward continued aeromagnetic data are coincident and have the same value. This means that
these data are both sensing the same anomalous magnetic body and that the Earth?s main field has
been correctly and completely removed from both data sets.
We made an estimate of the depth-to-source of the magnetic body from an analysis of these
satellite magnetic anomaly data. The method used was originally developed by D. Ravat and P.
Taylor and is based on the property that the rate of decrease of the anomaly amplitude with distance
from the source is a known function. This method, which is best suited to nearly circular, isolated,
large amplitude anomalies, yielded a depth of between 20 and 30 km for the source of the
anomalous mass responsible for the Kiruna anomaly. Since the thickness of the Earth's crust in the
Kiruna area is known to be less than 46 km this would place the magnetic source body in the mid to
lower crust.
The major fracture zone of this region, based on geologic mapping, are superimposed on the Magsat
anomaly map (Figure 1A). The intersection of the major fracture zones lies very near the center of
the Kiruna anomaly. It is, therefore, interesting to speculate that the anomalous magnetic mass
causing the satellite-altitude anomaly is not only deep-seated but may also be related to the fracture
zone pattern. It has been suggested by others that major lineaments play a role in the emplacement
of the ore deposits of Northern Sweden and that major mineralization of the upper crust is controlled
or localized by large and deep fractures in the crust. The fracture zones could provide migration
routes allowing lower crustal material to be emplaced in the upper crust.
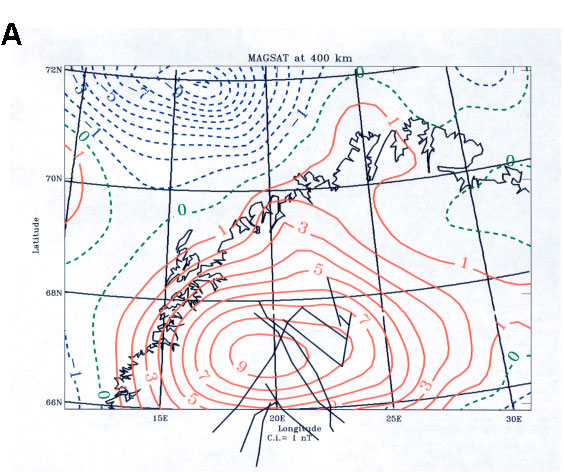
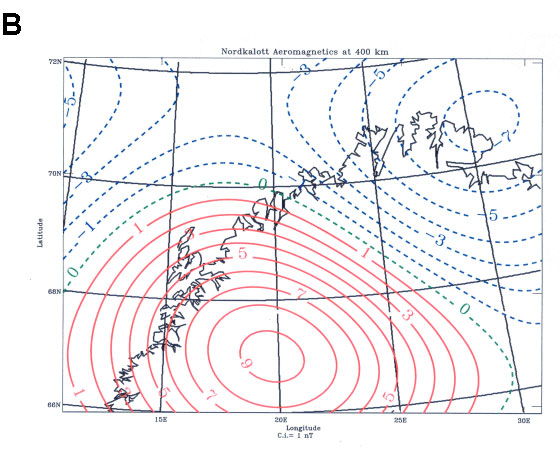 Figure 1