Heat flux and magnetic crustal thickness updates based on latest satellite magnetic field model and Fox Maule et al. (2005) approach

Heat flux model

crustal thickness model

Polar heat flux data set (Longitude, Latitude, Heatflux) used to make the above figures

Validation of the technique, and an improved 4-layer model for the thermal conductivity and heat production of the crust by Fox Maule et al. (2009).

Polar heat flux data set (Longitude, Latitude, Heatflux) update to Fox Maule et al. (2009) paper

Polar magnetic crustal thickness data set (Longitude, Latitude, thickness) update to Fox Maule et al. (2009) paper

Australia heat flux data set (Longitude, Latitude, Heatflux) update to Fox Maule et al. (2009) paper

Australia magnetic crustal thickness data set (Longitude, Latitude, thickness) update to Fox Maule et al. (2005) paper

GMT script for producing low and mid latitude crustal thickness figure above based on update to Fox Maule et al. (2005) paper

Global crustal thickness model based on update to Fox Maule et al. (2005) paper. First two elements are latitude and longitude, and 7th element is crustal thickness.

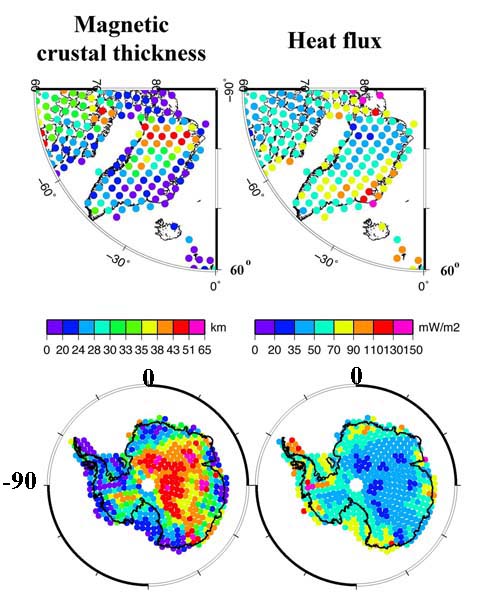
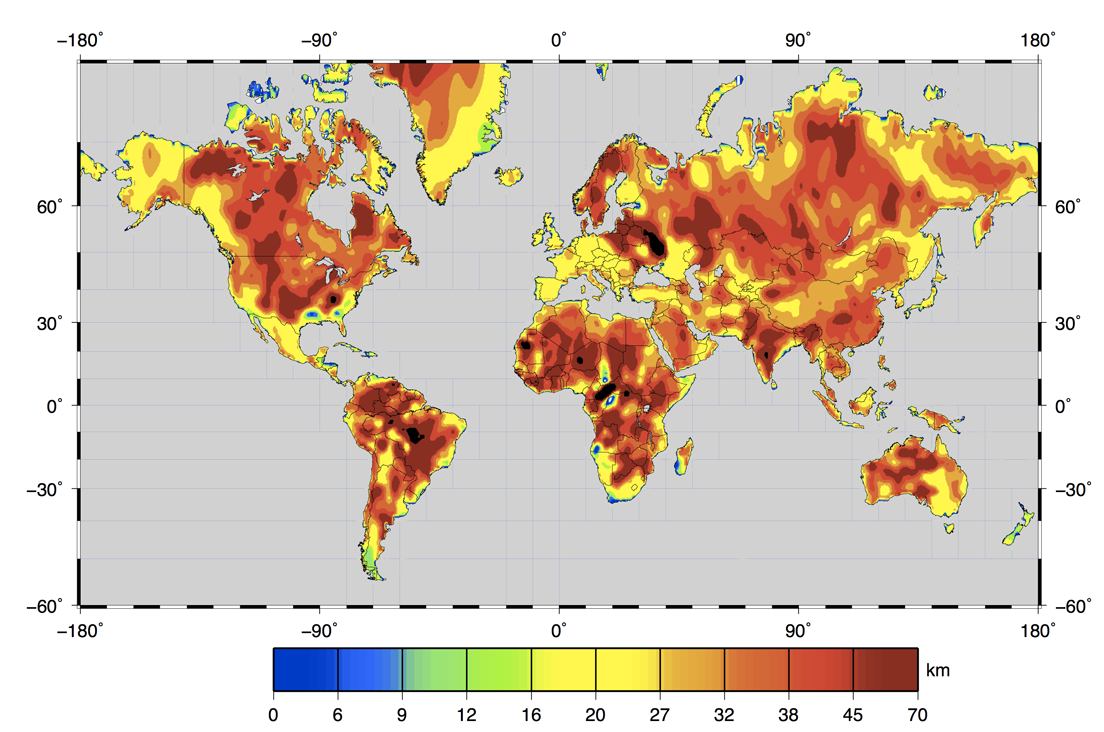
Users of the above data set should cite the original Science paper by Fox Maule et al. (2005). The satellite magnetic field model used here is MF-7, based on CHAMP, and is available from geomag.org. Oceanic crust is masked on the magnetic thickness map because magnetizations are dominated by remanent magnetizations. Two other continental regions, Bangui in central Africa, and Kursk in the Ukraine, are also associated with strong remanent magnetizations and are examples of the failure of the assumption that magnetic susceptibility dominates over remanence.

Corrections, additions, or changes should be sent to Michael Purucker at michael.e.purucker@nasa.gov

Back to Geodynamics Home Page

Last updated on 29 Apr 2014