Global Tectonic and Volcanic Activity of the Last One Million Years
Code 921, NASA/Goddard Space Flight Center,
Greenbelt, MD 20771
April 1997
Also see "Digital Tectonic Activity Map"
Larger version (284k)
To obtain a copy of this map please contact the author.
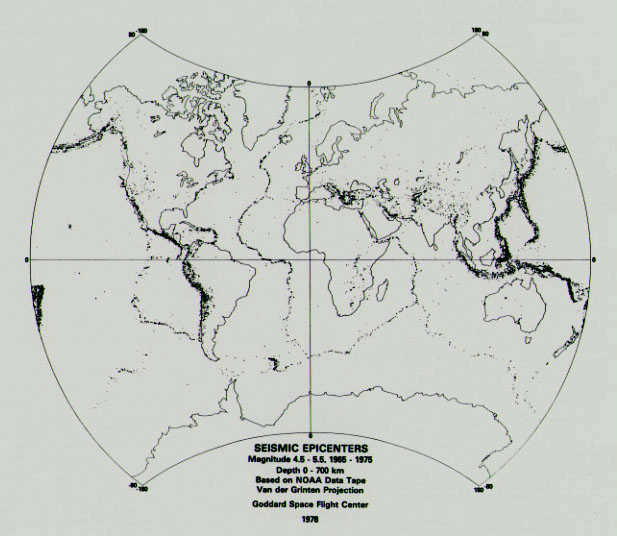
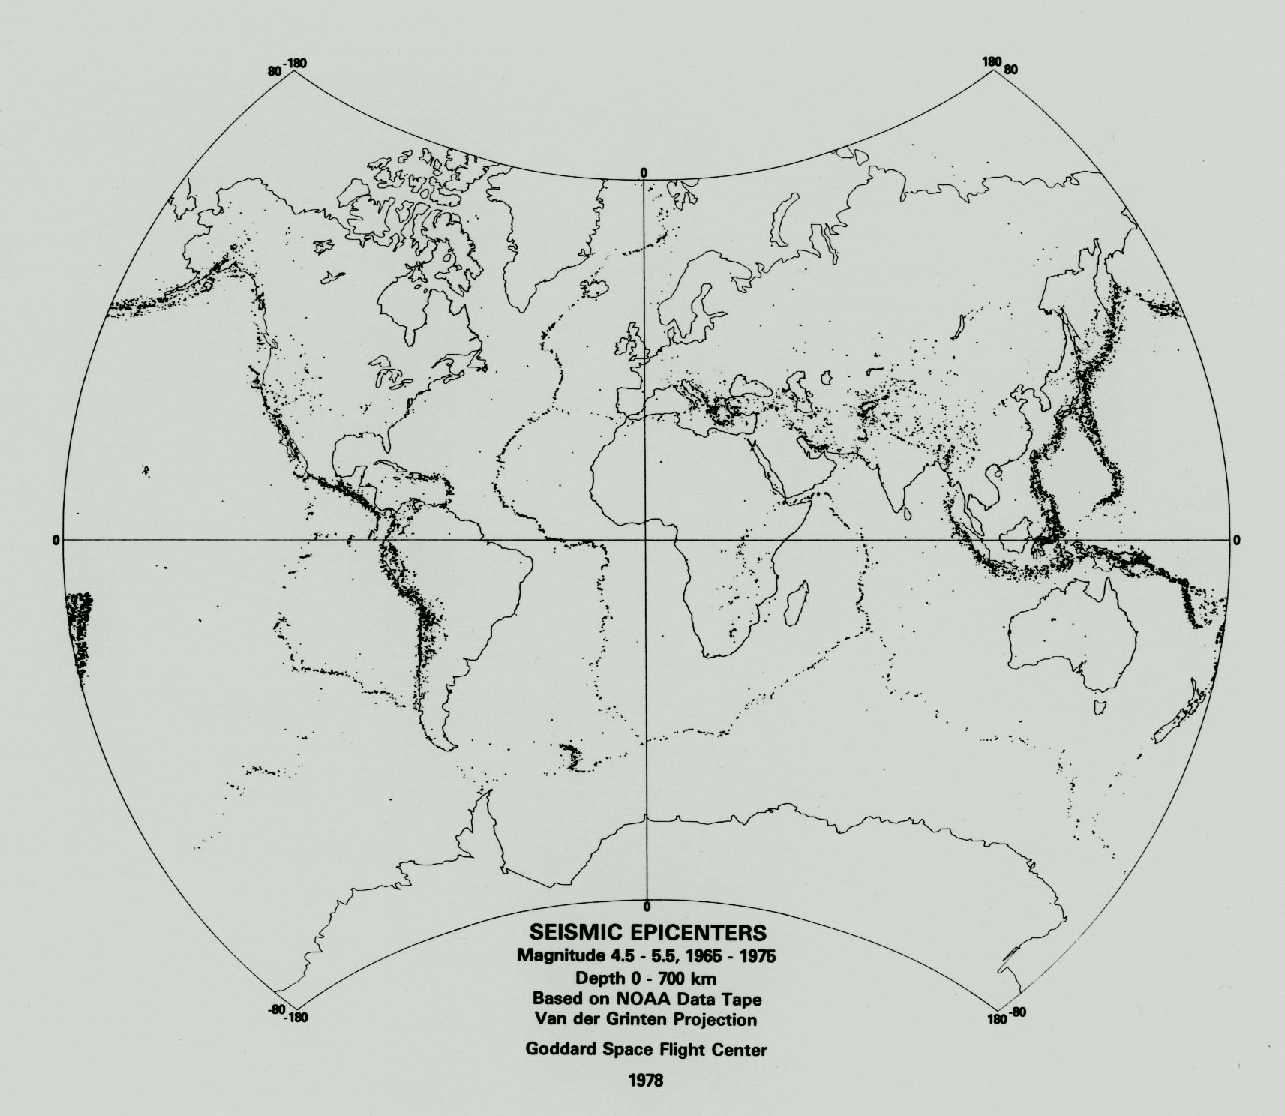
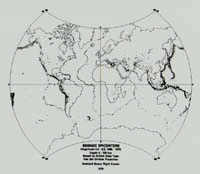 Seismic Epicenters (39k) or (129k)
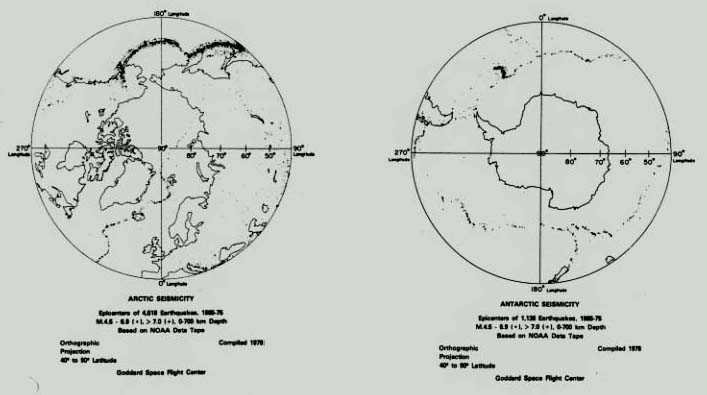
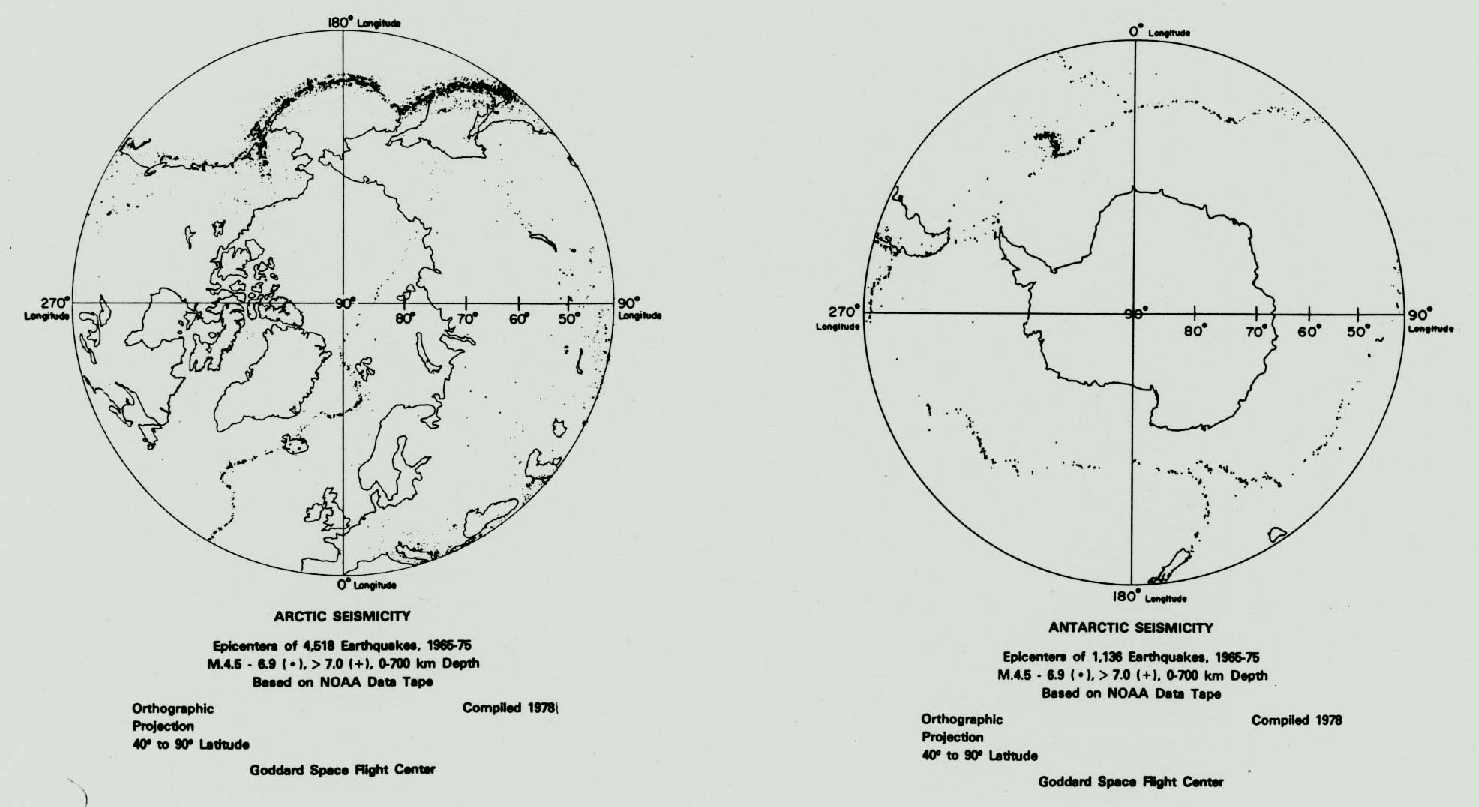
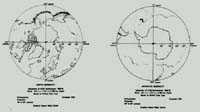 Polar Seismicity (30k) or (100k)
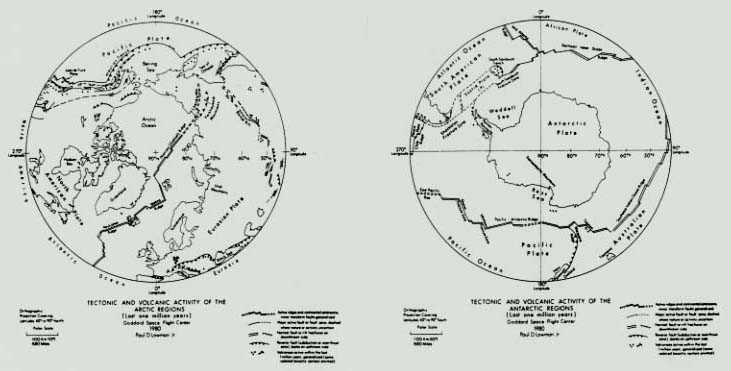
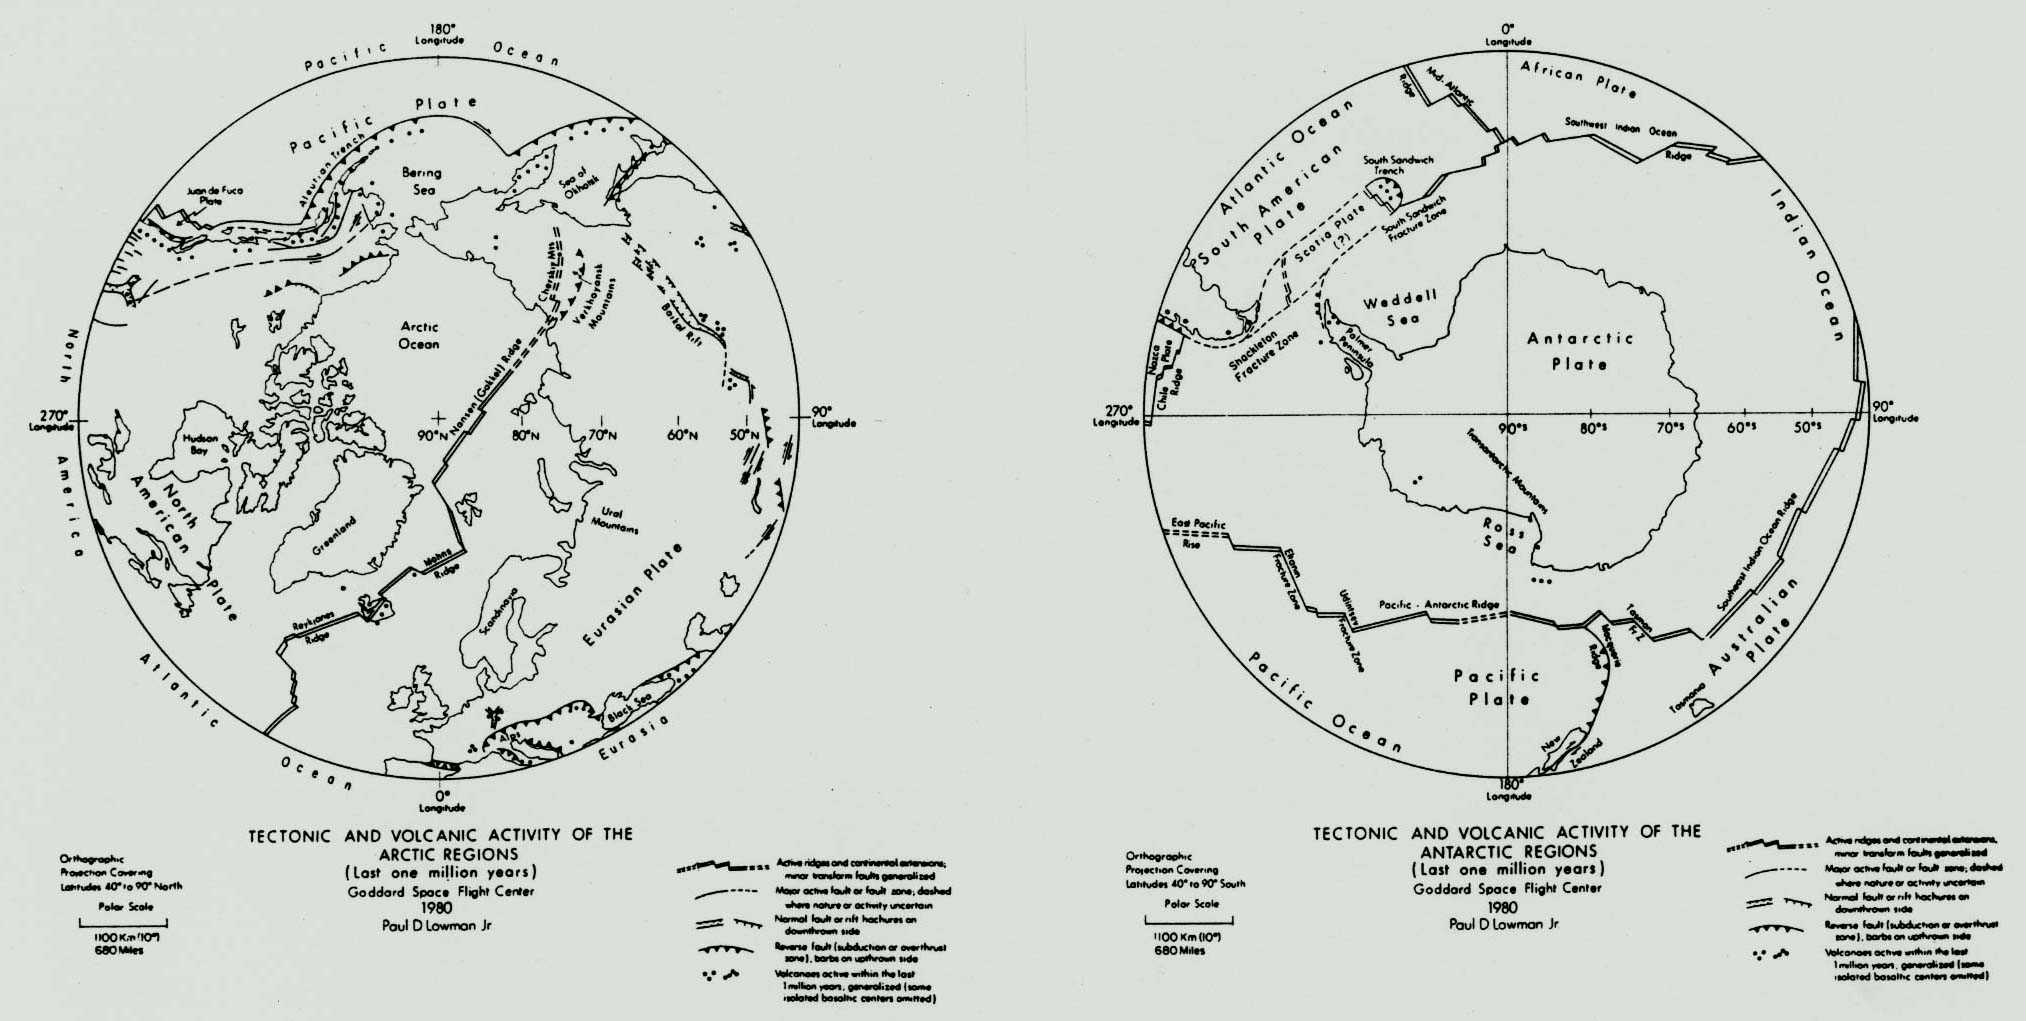
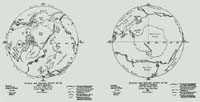 Polar Tectonics (35k) or (189k)
This map is not copyrighted and may be freely reproduced if the source is credited.
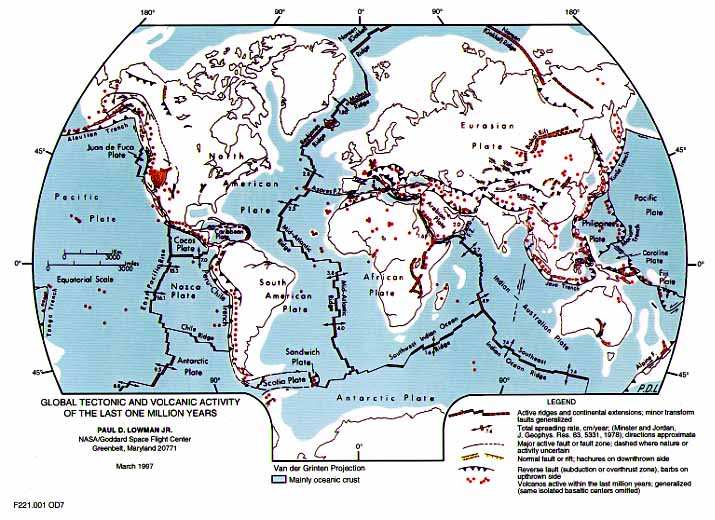
GLOBAL TECTONIC AND VOLCANIC ACTIVITY OF THE
LAST ONE MILLION YEARS
Paul D. Lowman Jr.
NASA/Goddard Space Flight Center (Code 921)
Greenbelt, Maryland 20771
April 1997
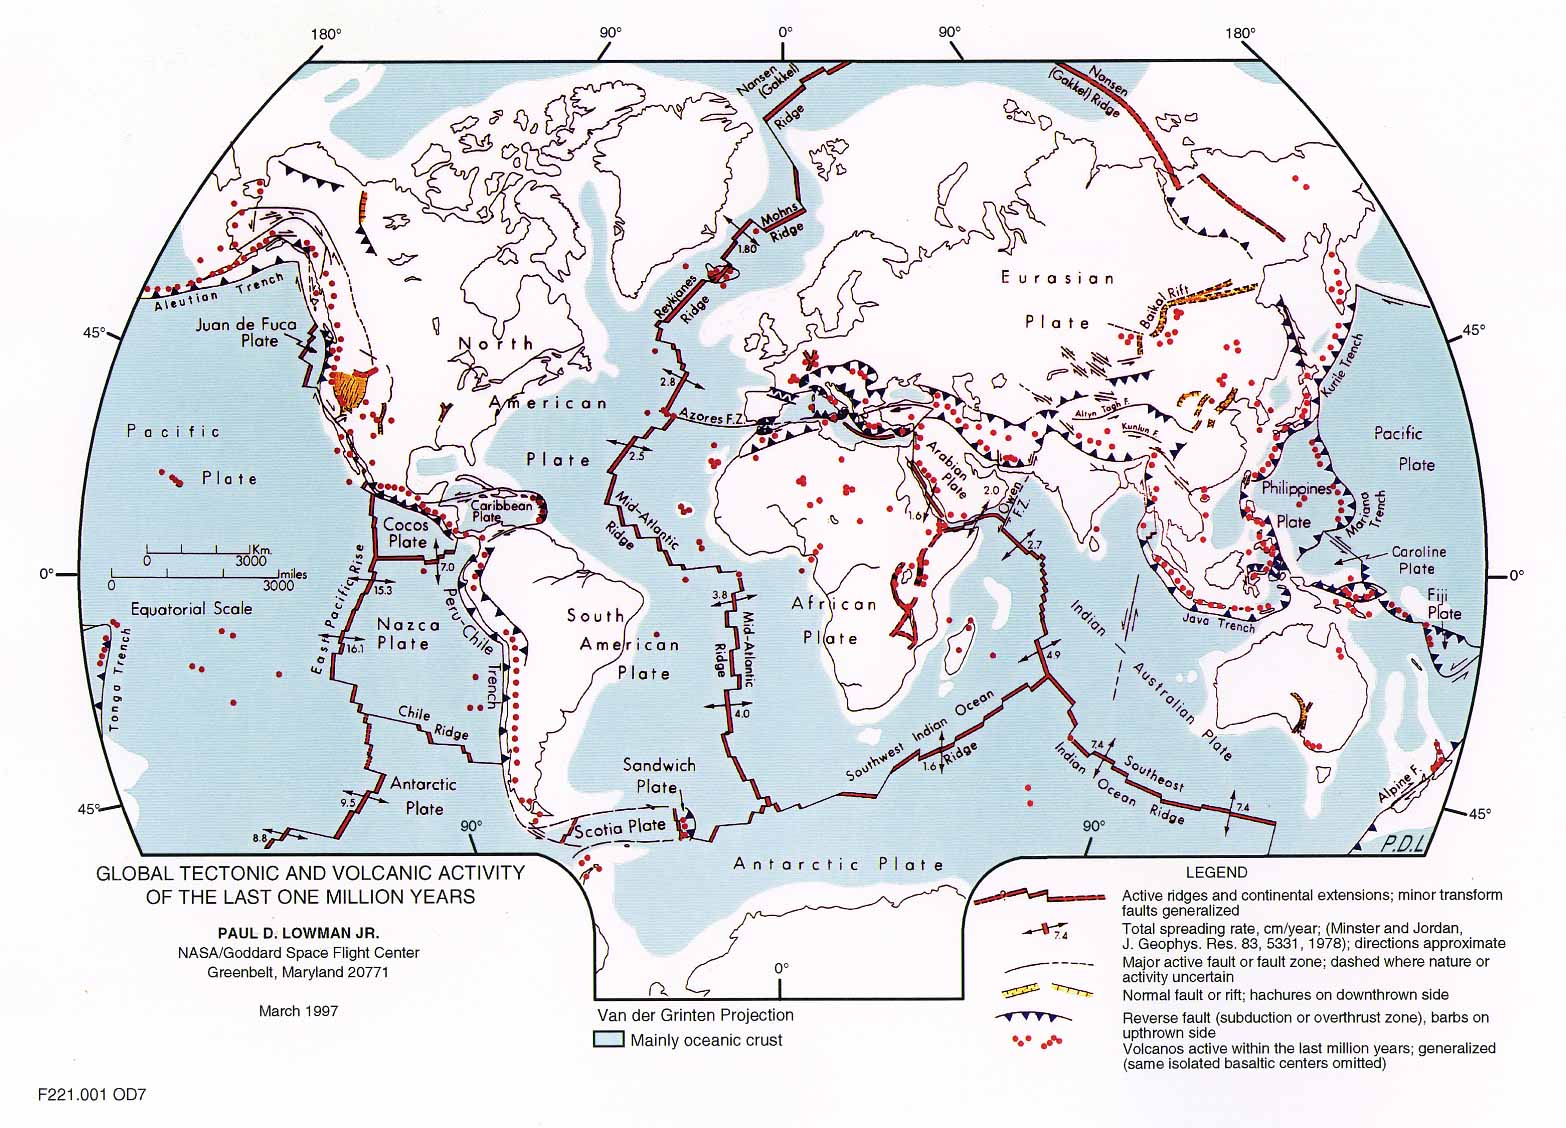
The maps on these sheets are intended to give a schematic and generalized
but realistic view of the Earth's major tectonic and volcanic features
active within the last one million years. Originally presented at the 1980
International Geological Congress, the main (equator-centered) map has
been up-dated to take advantage of recent advances such as the 1994 compilation
of world volcanoes by Simkin and Siebert. It is presented here, with the
original polar projection maps, because of its relevance to global change
and geologic hazard studies.
The well-known geologic maxim, "the present is the key to the
past," has a complement: the present is the key to the future, both
with caveats that need not be discussed here. The key word in both is "present."
The Earth is 4.5 billion years old, and the geologic events of a single
year, decade, or even century are not representative of the "present"
in terms of geologic time. The historical record of volcanic activity,
for example, goes back only a few thousand years, yet there are innumerable
apparently extinct volcanoes still potentially active. However, conventional
geologic maps do not give a good view of the geologic present either, being
cumulative representations of features formed over hundreds of millions
or even billions of years. There is thus a gap between geologic maps and
maps showing historically recorded volcanism and tectonism. Those presented
here are intended to bridge this gap by showing volcanic and tectonic features
active within the last one million years.
The one million year period was chosen primarily because features such
as volcanoes, lava flows, and fault scarps survive as grossly recognizable
landforms for about a million years in most land areas. Orbital photography
and Landsat imagery have been used, directly and indirectly, in compilation
of this map. In some areas, notably south-central Asia, our first realistic
knowledge of regional tectonism came from Landsat imagery as used by Molnar
and Tapponnier in their 1975 study. Many unmapped individual volcanoes
and even volcanic fields have been discovered on orbital photography, and
little known ones brought to the compiler's attention. It is believed that
the map thus gives a much more comprehensive picture of continental volcanism
than previously available (Christy and Lowman, 1995). However, marine investigations
continue to uncover areas of previously unknown active subsea volcanism
and further additions to this map will no doubt be made in future editions.
A new feature of the present edition is approximate representation
of the Earth's continental/oceanic crustal dichotomy. Continental margins
are much more fundamental features than coastlines, and the present map
shows such margins primarily as the edge of the continental shelves (the
continental slopes), with the proviso that the slopes may not be a sharp
boundary between continental and oceanic crust. Furthermore, there are
numerous features of the ocean basins underlain by continental crust. For
example, the Lord Howe Rise northwest of New Zealand is largely at abyssal
depths, over 1500 meters, but is known to consist of continental (sialic)
crust. The Rockall Plateau in the North Atlantic similarly consists of
granitic rocks. On the other hand, some prominent marine features, such
as the Kerguelen Plateau, are apparently oceanic in composition, and are
not shown on the map. The distribution of the "mainly oceanic crust"
is accordingly based on a combination of bathymetric, geological, and geophysical
data. Two references of particular value in drawing this aspect of the
map are the compilation edited by Burk and Drake (1974) and the paper by
Nur and Ben-Avraham (1982) in a special JGR issue on accretion tectonics.
An important aspect of these maps is their representation of continental
tectonism, in particular the broad diffuse nature of supposed plate boundaries.
The greater deformability of continental crust has been recognized for
many years. Its cartographic importance is the near impossibility of representing
plate boundaries in continents simply, as done by many "plate maps."
The maps presented here are offered as views of continental tectonism more
realistic than mathematical plate models.
Plate motion and rigidity have been directly measured in many areas
by space geodesy, specifically satellite laser ranging and very long baseline
interferometry, and more recently by the Global Positioning System. The
primary phenomena of plate tectonics - sea-floor spreading and subduction
-have thus been demonstrated beyond reasonable doubt for the various plates
making up the Pacific Ocean (Lowman, 1996). Directly measured plate motions
have proven surprisingly close to those inferred from the spacing of marine
magnetic anomalies, covering about 3 million years (Stein, 1993). The space
geodesy data will be shown in future editions of this map. However , the
spreading rates calculated by Minster and Jordan (1978) are retained in
this one.
These maps have proven effective in geologic education, and have been
used in several textbooks. They are not subject to copyright and may be
freely reproduced if the source is credited.
The following is a list of major recent references. For data sources
of the original map, the reader is referred to Lowman (1981).
References
- Burk, C.A., and Drake, C.L., 1974, The Geology of Continental Margins,
Springer-Verlag, New York, 1009 p.
- Christy, B.M., and Lowman, P.D. Jr., 1995, Global maps of volcanism:
Two maps from two centuries, presented at the 20th Symposium, International
Commission for the History of Geology, Naples, Italy; in press, symposium
proceedings.
- Lowman, P. D., Jr., 1981, A global tectonic activity map, Bulletin
of the International Association of Engineering Geology, No.23, p.37-49.
- Lowman, P.D., Jr., 1982, A more realistic view of global tectonism,
Journal of Geological Education, v.30, p. 97-107.
- Lowman, P.D., Jr., 1996, Twelve key 20th-century discoveries in the
geosciences, Journal of Geoscience Education, 44, 485-502.
- Minster, J.B., and Jordan, T.H., 1978, Present-day plate motions, Journal
of Geophysical Research, 83, 5331-5375.
- Molnar, P., and Tapponnier 1 P., 1978, Active tectonics of Tibet, Journal
of Geophysical Research, 83, 5361-5375.
- Nur, A., and Ben-Avraham, Z., 1982, Oceanic plateaus, the fragmentation
of continents, and mountain building, Journal of Geophysical Research,
87, B5, 3644-3661.
- Simkin, T., et al., 1989, This Dynamic Planet, World Map of Volcanos,
Earthquakes, and Plate Tectonics, U.S. Geological Survey.
- Simkin, T., and Siebert, L., 1994, Volcanos of the World, 2d ed., Smithsonian
Institution, Geoscience Press, Tucson, Arizona.
- Stein, S., 1993, Space geodesy and plate motions, in Contributions
of Space Geodesy to Geodynamics: Crustal Dynamics, D. E. Smith and D. L.
Turcotte, Editors, American Geophysical Union. p. 5-20.
Bibliography: Publications using
Tectonic Activity Map
*Books
- Bates, C. C., Gaskell, T. F., and Rice, R.B., Geophysics in the Affairs
of Man, Pergamon Press, New York, 1982, 492 p.
- Best, M. G., Igneous and Metamorphic Petrology, W. H. Freeman, San
Francisco, 1982, 630 p.
- Brown, G. G., Hawkesworth, C.J., and Wilson, R.C.L., Understanding
the Earth: A New Synthesis, Cambridge University Press, Cambridge, 1992,
551 p.
- Chatterjee, S., and Hofton, N., New Concepts in Global Tectonics, Texas
Tech University Press, Texas, 1992, 449 p.
- Cloud, P.E., Oasis in Space, W. W. Norton, New York, 1988.
- Consolmagno, G.J., and Schaefer, M.W., Worlds Apart: A Textbook in
Planetary Sciences, Prentice Hall, Englewood Cliffs, 1994, 323 p.
- Davis, G. H., Structural Geology of Rocks and Regions, John Wiley,
New York, 1984, 492 p.
- Head, J.W., Geology of the inner planets, in Astronomy from Space,
J. Cornell and P. Gorenstein, Editors, MIT Press, Cambridge, MA, 1983,
p.20-66.
- Peltier, W.R. (Editor), Mantle Convection, Plate Tectonics, and Earth
Dynamics, Gordon and Breach, 1989, 881 p.
- Redfern, M., Journey to the Centre of the Earth, Broadside Books, London,
1991, 143 p.
- Short, N.M., and Blair, R.W.jr., Geomorphology from Space, Special
Publication 486, National Aeronautics and Space Administration,1986, 717
p.
- Siegal, B.S., and Gillespie, A. R., Remote Sensing in Geology, John
Wiley, New York, 702 p.
Technical Papers, reports
- Geodynamics Program Office, NASA, Application of Space Technology to
Crustal Dynamics and Earthquake Research, Technical Paper 1464, 1979, 274
pp.
*Exclusive of Lowman publications
- Hieber, S., Space techniques to monitor movements in the Earth's crust,
Space Education, 1, 200- 203, 1983.
- McKelvey, V.E., Seabed minerals and the law of the Sea, Science, 209,
464-472, 1980.
- McKelvey, V. E., Subsea Mineral Resources, U.S. Geological Survey Bulletin
1689-A, 1986, 106 p.
- Rubincam, D.P., Information theory lateral density distribution for
Earth inferred from global gravity field, Journal of Geophysical Research,
87, B7,
5541-5552.1982.
 Seismic Epicenters (39k) or (129k)
 Polar Seismicity (30k) or (100k)
 Polar Tectonics (35k) or (189k)