

Responsible NASA official: David Harding
Geolocation and Waveform Processing Team:
Scott B. Luthcke, Claudia C. Carabajal,
Waipang Fong & Shelley C. Rowton
![]()
INTRODUCTION:
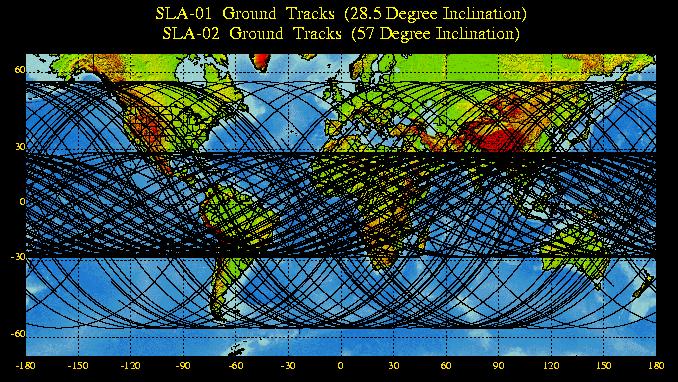
This site was implemented to provide direct access to laser altimeter data collected during the second flight of the Shuttle Laser Altimeter, which flew during the STS-85 mission during August of 1997. Documentation describing processing of the data to allow geolocation, the measurement georeferencing techniques used, shot classification and waveform processing algorithms descriptions are also provided. The Shuttle Laser Altimeter (SLA) is a pathfinder experiment devoted to: (1) evaluating engineering and algorithm techniques for high-resolution, orbital laser altimeter Observations of terrestrial surfaces, and (2) providing pathfinder scientific datasets of value in addressing global Earth System science issues (Garvin, et al., 1998). The first and second flights of SLA characterized ocean, land and cloud top elevation and vertical roughness in 100 meter diameter laser footprints spaced every 700 meters along a nadir profile. This directory contains the processed data files. The different files correspond to a SLA Observation period, which constitutes a period of continuous operation of the instrument. Twenty-three Observation periods of global laser altimetry data were acquired during the SLA-02 mission, with coverage between +/-57 degrees. Ground track maps showing the coverage of each Observation can be viewed in the SLA02 page (http://denali.gsfc.nasa.gov/research/laser/sla02/sla02.html), and Figure 1 shows the SLA01 and SLA02 tracks.
The nearly three million laser shots transmitted during the course of the 11-day mission yielded approximately 342,000 and 562,000 geolocated returns from land and ocean surfaces, respectively. A comprehensive analysis of the SLA-02 data included: conversion of engineering parameter to physical units, application of scaling factors to the digitized return to provide a consistent measure of backscatter energy, geolocation of the surface return which includes precise TDRSS-tracking based Shuttle orbit determination and pointing bias calibration, transformation to a Geoid reference frame, return type classification and waveforms analysis.
![]()
There are numerous parameters provided in the SLA-02 data distribution structure. They have been grouped in sub-structures that contain related information, which correspond to time-tag parameters, range parameters, parameters derived from the bounce-point geolocation and Shuttle orbit determination, the engeeneering parameters group (which includes instrument settings and the digitized waveform array), and the waveform analysis parameters group. The latter contains the results of the characterization of the digitized laser returns, a statistical description of the baseline and the extracted signal, environmental parameters that give a context to the geolocated bounce-point, such as TerrainBase topographic elevation, Normilized Difference Vegetation Index (NDVI) and Lancover data, the identification of invalid returns and valid ocean, land and cloud returns based on a comparison with known reference surfaces, and results from modeling of the waveforms by comparing the observations to a model using constrained non-linear least-squares minimizing techniques and characterizing the last return, corresponding to the lowest surface intercepted within the footprint. The dist_strfmt document presents a list of the parameters provided in the structure and their format, while parameters definitions are provided in SLA02_doc. Postcript and RTF format versions of the documents can also be downloaded from those links.
SLA Instrument Specifications:
| SLA Instrument Specification | Minimum | Maximum |
|---|---|---|
| Sensor: | ||
| energy per pulse (mJ) | 20 | 35 |
| pulse width (ns,full-width-at-half-maximun) | 15 at 35mJ (0-10¦C) | 20 at 20mJ (25-35¦C) |
| pulse repetition rate (pps) | 10 | |
| beam divergence (mrad,1/e2) | 0.25 | 0.40 |
| beam far field pattern | multi-mode | |
| receiver throughput (%) | 50 | 65 |
| bandpass filter width (nm) | 2 | 2.2 |
| detector field-of-view (mrad) | 0.75 | |
| detection sensitivity (nWatt) | 0.5 | 2 |
| Altimetry Electronics: | ||
| time interval range (counts) | 0 | 65536 |
| time interval resolution (ns/counts) | 10 with interpolation bit to 5 | |
| clock timebase (MHz) | 100 | |
| matched filter bandwidths (MHz) | 16.6,5.5,1.8,0.6 | 32,16.6,5.5 |
| noise counter range (counts/s) | 1 | 16384 |
| threshold setting range (mV) | 10 | 2550 |
| post-detection gain | 0.5 | 250 |
| system impulse response (ns, 1 sigma) | 20,60,180,540 | 10,20,60 |
| false alarm ratio | 1x10⁻⁵ | 1x10⁻⁴ |
| Pulse Digitizer: | ||
| digitizer input low pass filter (MHz) | 15 | 32 |
| sampling rate range (Megasamples/s) | 100 | 500 |
| waveform amplitude resolution (bits) | 8 | |
| number of waveform samples per pulse | 100 | 150 |
| Computer: | ||
| clock frequency (MHz) | 25 | |
| random access memory (Mbyte) | 1 | |
| erasable-prog.-read-only-memory (kbyte) | 256 | |
| flight software size (kbyte) | 150 | 180 |
| hard drive storage volume (Mbyte) | 340 | 540 |
| downlink data rates (kbyte) | 0.12 | 19.2 |
| Apogee | 291.999 km |
| Perigee | 281.945 km |
| Inclination | 57.903- |
| Eccentricity | 0.00075403 |
| Period | 90.237 minutes |
Ranging Data
SLA-02 is a hybrid instrument combining ranging electronics, modified from the Mars Observer Laser Altimeter (MOLA-1) design (Zuber, et al., 1992), with a high-speed digitizer used to record the backscatter return amplitude as a function of time. The MOLA design is based on leading-edge detection of the transmitted start pulse and a backscattered stop pulse, with detection defined by threshold levels. Thus, the resulting range is to the first encountered target from which the backscatter signal exceeded the threshold level. In the presence of optically dense clouds, SLA ranges to the cloud top. In the absence of dense clouds, SLA ranges to water, bare ground, or the canopy top in vegetated areas.
The range measured by the MOLA receiver electronics is the round-trip travel time between start and stop pulses as recorded by a Time Interval Unit (TIU). Detection of a stop pulse is evaluated in four channels, each of which has match filters of differing duration applied to accommodate pulse spreading of differing amounts. Upon detection of stop pulse event by one or more of the channels, the TIU travel time is defined using the triggered channel having the 'fastest' match filter (i.e. least smoothing). The sla02.rp.range parameter in the structure pertaining to the engeneering parameters is derived from it. For SLA-02 the match filters were modified from the original MOLA design as follows: Channel 1 = 16.6 MHz, Channel 2 = 5.8 MHz, Channel 3 = 32 MHz. Thus Channel 3 is the fastest filter, Channel 1 is intermediate, and Channel 2 is the slowest. Channel 4 is not used for detection of a stop pulse but instead was altered to record the duration of the return signal above the detection threshold level in Channel 1 (stored as sla02.ep.pwidth, the electronic pulse width). The parameter SLA02.ep.channel records which was the fastest channel triggered. Land and ocean returns triggered Channel 3 in almost all cases. The fastest channel triggered for cloud returns varied between channels depending on the degree of pulse spreading in the backscatter signal. The fastest channel triggered is defined by examining the receive energy levels for each channel. Normally for a channel where the backscatter signal did not exceed the threshold level (no detection in that channel), the receive energy level would be 0. Thus the triggered channel is the fastest channel with non-zero receive energy. However, it was noted for SLA-02 that in a several percent of no-range shots (where no channel exceeded threshold) there were channels with low, but non-zero, receive energy values. This artifact is not understood but it does indicate that, at the few percent level, there could be errors in defining the triggered channel for shots when a range was detected (a faster channel could be indicated than was actually the case).
![]()
SLA-02 DATA GEOLOCATION METHODOLOGY
![]()
Bounce-Point Geolocation
The geolocated 'bounce-point' position for each laser shot (given in sla02.bp.lat, sla02.bp.lon, sla02.bp.ellip_ht and sla02.bp.ortho_ht) is defined based on the range to the first detected target (geolocation methods are the same as those used for SLA-01, which are described at: http://denali.gsfc.nasa.gov/lapf/sla/srowton/). The documentation included above briefly describes the processing involved in geolocating the data (Link to New Geolocation Document), refering to the literature for further reading.
Pointing Angles
The sla02.pap.aoffnadir and sla02.pap.azimuth parameters provided in the structure correspond to the off-nadir angle and azimuth from North of the laser vector. They are computed from the Earth Center Fixed coordinates of the unit laser pointing vector at the Shuttle's position after pointing corrections were applied, and the location of the bounce point on the surface of the Earth. A coordinate transformation to Topocentric coordinates is made to calculate the vector's orientation at the bounce-point location. The azimuth is then derived from the magnitude of the North and East components, while the off-nadir angle is determinded by combining this information with the magnitude of the vertical component. Caution should be used when interpreting the values provided for data that was classified as invalid returns, such as no-range data, since the geolocation information associated with them would be incorrect.
Return Type Classification
Of particular use is the parameter sla02.wavgrp.cl.rtyp which classifies each laser shot as to its return type. Details are provided in the parameter definitions. In brief, shots are classified as being a return from an ocean surface, clouds above ocean, a land surface, clouds above land, or a non-valid return above ocean or land. Ocean and land categories are separated based on masks derived from the TerrainBase 5 minute resolution global terrain model. Ocean surface returns are defined as those shots whose orthometric elevation occurs within 20 m of sea level (elevation = 0). Land surface returns are defined as those shots whose orthometric elevation occurs within 500 m of Terrain Base (interpolated to the SLA bounce point location). A larger elevation range is used over land due to inaccuracies in Terrain Base and due to SLA geolocation errors caused by pointing and orbit uncertainty. Note that returns from low-lying clouds or fog will be classified as land by this scheme. Non-valid returns can be of several types but by far the most common is a no-range result where no return signal was detected for a laser pulse. The compressed postscript file grdtrk_all.ps.gz is a global map showing the coverage of returns from land surfaces for Observations 1, 2, 3, 4, 4a, 7, 8, 9, 10,11, 12, 13, 15, 16, 17, 18, 19 and 20. Waveform processing described below to chacterize the backscatter return was only applied to returns from the surface of the ocean (rtype = 25) and returns from the land surface (rtype = 15). Figure 2 shows the shot type distribution for all fully processed observation periods.
Electronic Pulse Width
The SLA electronic measure of pulse width (sla02.ep.pwidth) is recorded as an uncalibrated byte value. The SLA-02 implementation of this measure is analogous to modifications made for MOLA-2, but was not necessarily implemented in the receiver electronics in exactly the same way. Furthermore, ground testing was not done that would permit conversion of this parameter to a calibrated value of time above the Channel 1 threshold. Tests were done using a test signal with a square-wave impulse response that demonstrated a linear relationship between byte value and width of the square-wave input. However, these results can not be directly used to calibrate the pwidth measure of backscatter signals generated from a Gaussian transmit pulse and smoothed via the Channel 1 16.6 MHz filter. As an alternative, sla02.ep.pwidth can be calibrated by comparison to the width of the backscatter signal digitized by SLA-02, described below. Comparison of pwidth to the digitized backscatter must be done as a function of Channel 1 threshold, as the pwidth duration depends on threshold level. Also note that pwidth is derived from the 16.6 MHz channel whereas the digitized signal is a record of the faster 32 MHz channel.
Waveform Digitization
The MOLA ranging electronics were augmented in SLA-02 by a digitizer capability. By means of a power splitter, the signal output by Channel 3 is continuously sampled by an analog-to-digital 8-bit digitizer. The digitized Channel 3 backscatter signal (i.e. waveform) is stored in sla02.ep.waveform as the raw 8-bit digitizer count per digitizer bin. Digitizer counts, which are a function of several instrument parameters that were varied throughout the mission, are not a direct measure of received energy. Digitizer counts can be converted to consistent units by application of sla02.ep.scale_factor, yielding a non-attenuated waveform amplitude. This conversion to consistent waveform amplitude units allows comparison of waveform amplitudes even when acquired under differing instrument parameter configurations. These consistent units are in terms of a reference detector gain, but are reported simply as amplitude counts that have not been calibrated to watts of received energy. The time resolution per digitizer bin also varied during the mission. Conversion of digitizer bins to time is achieved by applying sla02.ep.bin_size. Typically bin_size was 4 nanoseconds during Observations 1 - 4 and 10 nanoseconds for the remaining Observations, in terms of round-trip (i.e., two-way) travel time.
The SLA-02 digitizer is comprised of two channels (A & B). The digitization rate per channel is adjustable and was varied during the SLA-02 mission. The maximum rate per channel is 250 Hz. The two channels can be individually read and stored in an interleaved manner with odd and even digitizer bins alternating between the two channels (sla02.ep.average = 0) or the channels can be averaged together before being stored as a single digitizer bin value (sla02.ep.average = 1). Almost all SLA-02 data were acquired with digitizer averaging implemented. After flight, it was discovered that one of the digitizer channels intermittently had a bit (or bits) 'stuck' either on or off, in effect reducing the bit resolution of the recorded amplitude levels and thus introducing systematic noise. This intermittent effect has not been fully analyzed but seems to have had a minor impact on the quality of the digitized backscatter signal. It can be assessed by comparing even and odd digitizer bins in data acquired with no digitizer averaging. Observations 1, 4, and 6, include waveforms with no digitizer averaging. Because of the way the digitizer was sampled, there is no consistent mapping between even vs. odd bins and A vs. B channels. Thus, the stuck bit effect could appear in either the even or averaging implemented due to the combination of the two channels.
Comparison of the two channels when not averaged also shows that the background levels of the two channels, defining the amplitude level for no receive signal, differ slightly. The impact of this effect on waveform quality when the channels are averaged is thought to be minor.
In order to relate the TIU ranging result to the digitized waveform signal, one would ideally want to know the waveform bin position of the TIU stop-pulse event. However, for SLA-02 this correspondence is not constant, for a variety of reasons, and is not specified in the instrument data record. The continuously sampled Channel 3 signal is recorded in the digitizer in a rolling memory. Upon detection of the stop pulse 150 bins are read from the digitizer memory, forming the raw waveform. The position of the 150 bins read from the digitizer are offset to ensure that the starting position (bin 0) read from digitizer memory occurs prior to the TIU stop pulse event. Thus signal 'noise' prior to detection of the stop pulse is recorded at the beginning of the waveform. The offset applied varies as a function of which is the fastest MOLA receiver channel triggered, defining the TIU stop pulse event. Default offsets were selected that were intended to increase with decreasing speed of the fastest channel triggered in order to accommodate increased range-walk for more broadened pulses. However the default offsets were predicated on the original MOLA order for match filter speeds (Channel 1 to 4 being fastest to slowest) and did not account for the change in SLA-02 making Channel 3 the fastest. Furthermore, the logic used in the on-board software to decide which is the fastest channel triggered (based on non-zero receive energy) also assumes the original MOLA order for channel speed. Thus the offset applied does not correspond to what was in fact the fastest channel triggered. The applied offset is stored as sla02.ep.wave_offset as an uncalibrated number. As the offset value increases the digitizer bin position corresponding to the TIU stop-pulse event increases (and thus more pre-detection noise is included at the start of the waveform) but the correspondence between offset value and number of digitizer bins has not been calibrated.
The correspondence between offset value and stop-pulse event can be established by examining waveforms with the same offset value and bin size to determine the bin position at which the leading edge of the receive signal consistently rises above the background noise. Examination of SLA-02 waveforms in this way reveals two types of 'jitter' in the position of the stop pulse event. For all shots, there is a small-scale jitter whereby the leading edge varies by about +- 3 bins. It was anticipated there would be a small-scale jitter of +- 1 bin due to the coupling between separate internal clocks used by the MOLA ranging electronics and the digitizer. The somewhat larger than anticipated jitter of +- 3 bins is not currently understood. Following Observations 1-4 a much larger jitter was observed intermittently affecting a small percentage of shots. The magnitude of this intermittent jitter appears to be random. Infrequently the jitter was so large that the stop pulse event could be shifted by a large number of bins causing it to occur before or after the 150 digitizer bin range sampled to record the waveform. In order to compensate for this large jitter, following Observation 4 the bin size was increased from 4 to 10 nanoseconds so that the 150 waveform bins would cover a larger range of time and thus more likely include the stop pulse event. Also, the waveform offsets were increased in order to shift the intended position of the stop pulse event to the center of the waveform. The cause of this intermittent, larger jitter is also not currently understood.
Because of the above described uncertainties in the bin position of the stop pulse event, the first step in analysis of SLA-02 waveforms establishes the bin position in which the receive signal first exceeds the background noise level of the waveform. This signal start position is stored as sla02.wavgrp.wv.start. Although not necessarily identical to the TIU stop pulse event, it should be essentially equivalent.
In some cases the start position was not established and no further processing was applied to the waveform. In those cases, sla02.wavgrp.gm.cfflag is set to 2. Sla02.wavgrp.gm.cfflag is also set to 2 for several other circumstances for which processing of the waveform was not done (other conditions are listed in the parameter definitions file). Processing of the waveform defines a large number of waveform attributes, establishes the number of maxima (i.e., peaks) that are present in the waveform, and fits Gaussian distributions to the maxima using a least-squares optimization (see document describing the waveform processing procedures below).
![]()
WAVEFORM PROCESSING PROCEDURES
![]()
Transmit Pulse Width
Unlike upcoming lidar missions (Vegetation Canopy Lidar, and the Ice, Cloud, and Land Elevation Satellite), SLA-02 does not digitize the shape of the outgoing transmit pulse so a direct measure of pulse character on a shot-by-shot basis is not available. However, the impulse response, due to the transmit pulse convolved with the Channel 3 receiver electronics, can be established from backscatter returns reflected from flat, smooth surfaces. The width of the received impulse response for SLA-02 has been established by plotting the waveform measure of pulse width (sla02.wavgrp.wf.width) versus maximum amplitude (sla02.wavgrp.wf.max) for non-saturated, land and ocean returns that have a single peak. A cloud of points results bounded at small pulse widths by a discrete edge that increases with increasing maximum amplitude at low amplitudes and which asymptotes at a constant pulse width at moderate to high amplitudes. The discrete edge is assumed to be defined by returns from smooth, flat surfaces yielding minimum return pulse widths. Most land shots plot at greater pulse widths than this discrete edge due to pulse broadening caused by interaction with a sloped or rough surface. A very small number of unexplained, anomalous shot artifacts occur at widths less than the discrete edge. The decrease in pulse width of the discrete edge at low maximum amplitudes is consistent with the way in which width at a threshold varies with peak amplitude (i.e. rangewalk effect). The asymptote pulse width defines the impulse response pulse width in terms of the full pulse width at a threshold level above background noise. The SLA-02 impulse-response full pulse-width is approximately 50 nsec, equivalent to a distance of 15 m. Assuming a symmetric impulse response, the half width from the start-pulse threshold crossing to start-pulse centroid (sp_centroid) is approximately 25 nsec, or 7.5 m.
Waveform Saturation
A final parameter of particular value in evaluating waveforms is sla02.wavgrp.cl.styp which defines the waveform saturation type. When the strength of the backscatter return exceeds the detection limit of the detector, the resulting signal becomes saturated. Saturated signals are corrupted and must be interpreted with considerable care. A Variable Gain Attenuator (VGA) was added to SLA-02 to vary the detector gain Level with the purpose of reducing the amount of saturation as compared to that which occurred during the SLA-01 mission. The sla02.ep.scale_factor parameter referred to above that converts raw digitizer counts to consistent waveform amplitude units is a function of the VGA setting and a digitizer attenuator setting. Using the VGA, the detector gain level was manually varied during the mission, as a function of surface type (ocean, bare land, vegetated land), in order to minimize the number of shots that were saturated. None-the-less, some saturation of shots did occur.
Sla02.wavgrp.cl.styp indicates 5 saturation states. 0 = not saturated, 1 = near saturation, 2 = 'linear' saturation where the signal is only slightly saturated, 3 = 'non-linear' saturation of type I, where the signal is deeply saturated, and 4 = 'non-linear' saturation of type II. After recognition of the stuck-bit issue described above, it was realized that styp=4 is a misnomer in that it is not a saturation case. It is characterized by a large peak in the waveform containing a pronounced, but narrow, amplitude dip in the center of the peak. This dip is due to noise imposed by a stuck bit in one of the digitizer channels.
For styp = 3 (deeply saturated), the shape of the return pulse leading edge up to the point of saturation is properly recorded, but the width of the pulse, the abrupt decrease in amplitude at the trailing edge, and subsequent detector 'ringing' (amplitude oscillations about the background level) are artifacts. Based on detector response in saturation, it is thought that the area under the saturated return is approximately equal to what the area would have been if the detector had a greater detection range and the signal were not saturated. This assumption of preserved area and the shape of the leading edge are used to fit a Gaussian distribution to saturated returns that models a non-saturated return, yielding an approximate measure of waveform parameters (width, amplitude, position, etc.). For styp = 4, if the doublet peaks created by the dip in the center of the peak were sufficiently close together, the doublets were treated as a single peak during fitting of the Gaussian distribution, and the peak amplitude is corrected for the effect of the anomalous dip.
![]()
![]()
Data files distributed on 2/8/99 included Observations 1, 2, 3, 4, 7, 8, 9, 12, 13, 15, and 20 (in 4 parts). Re-processing of these files for geolocation has been completed, and the the ditribution site has been updated with the new files. New files for Observations 4a, 10, 11, 16, 17, 18, 19 have been added to this new distribution list. Observations 5, 6, 14, 14a and 21 contain problems in the raw data files which may preclude processing.
The individual Observation data files are stored as Interactive Data Language (IDL) save files, and as stream binary files. The files have been compressed using the public domain utility gnuzip. Upon restoration of a save file in IDL, a structure named sla02 is created. Refer to the preceeding documents for a description of the substructures and a definition of the various parameters (see SLA02_doc and dist_strfmt for parameters descriptions and their format).
![]()
SOFTWARE TO READ DISTRIBUTION DATA
![]()
The code provided allows the user to read the retrieved binary files, and see the various parameters. Modifications to the code can be made to accommodate particular interests the users may have. The file read_bin_sla.c is just a simple demonstration program to read the data from the SLA binary file, which opens the binary file for a particular Observation, and prints out all the information for a particular shot requested by the user.
There are two main procedures: READ_ONE_SHOT and PRINT_ONE_SHOT. READ_ONE_SHOT will gather all the information of each shot and put into the SLA structure, which is defined in the SLA02_STRUCTURE.H file, specifying all the parameters and their data type for each shot. PRINT_ONE_SHOT will just display all contents of the SLA structure.
![]()
REFERENCES
![]()
Garvin, J., J. Bufton, J. Blair, D. Harding, S. Luthcke, J. Frawley, and D.D. Rowlands, 1998, Observations of the Earth's topography from the Shuttle Laser Altimeter(SLA): laser-pulse echo-recovery measurement of terrestrial surfaces, Phys. Chem. Earth, 23(9-10):1053-1068.
Zuber, M.T., D.E. Smith, S.C. Solomon, D.O. Muhlemen, J.W. Head, J.B. Garvin, J.B. Abshire, J.L. Bufton, 1992, The Mars Observer laser altimeter investigation, J. Geophys. Res., 97(E5), 7781-7797.
Rowlands, D.D.,S.B. Luthcke, J.A. Marshall, C.M. Cox, R.G. Williamson, and S.C.Rowton, 1997, Space Shuttle Precision Orbit Determination in Support of SLA-1 Using TDRSS and GPS Tracking Data, The Journal of the Astronautical Sciences, 45(1):113129.
Bufton, J.L., D.J. Harding and J.B. Garvin, 1999, Shuttle Laser Altimeter: Mission Results & Pathfinder Accomplishments, Laboratory for Terrestrial Physics, Goddard Space Flight Center, Greenbelt, Maryland.
Carabajal, Claudia C., David H. Harding, Scott B. Luthcke, Waipang Fong, Shelley C. Rowton and J.J. Frawley, Processing of Shuttle Laser Altimeter Range and Return Pulse Data in support of SLA-02, to be published in the Proceedings of the ISPRS Workshop on "Mapping Surface Structure and Topography by Airborn and Spaceborn Lasers", La Jolla, CA, 1999.
Luthcke, S.B., C.C. Carabajal, D.D. Rowlands, D.E. Pavlis, 2000, Improvements in Shuttle Laser Altimeter Data, in preparation.
![]()
CONTACT THE SLA-02 GEOLOCATION AND WAVEFORM PROCESSING TEAM
![]()
![]()
NASA/GSFC Security and Privacy Statement, Disclaimer, and Accessibility Certification
Last updated: 03/31/2003