Below are links to the JPEG and EPS/PS format files for the graphics in Chapter 4 of Sea Level Rise, Edited by Bruce C. douglas, Michael S. Kearney, and Stephan P. Leatherman.
Figures:
Figure 4.1. RSL Change Obtained From Linear Regression of Tide Gage Data: JPG, EPS
Figure 4.2. The VM1, VM2, and VM3 Radial Viscosity Profiles: JPG, EPS
Figure 4.3. ICE-4G Ice Thickness: JPG, EPS
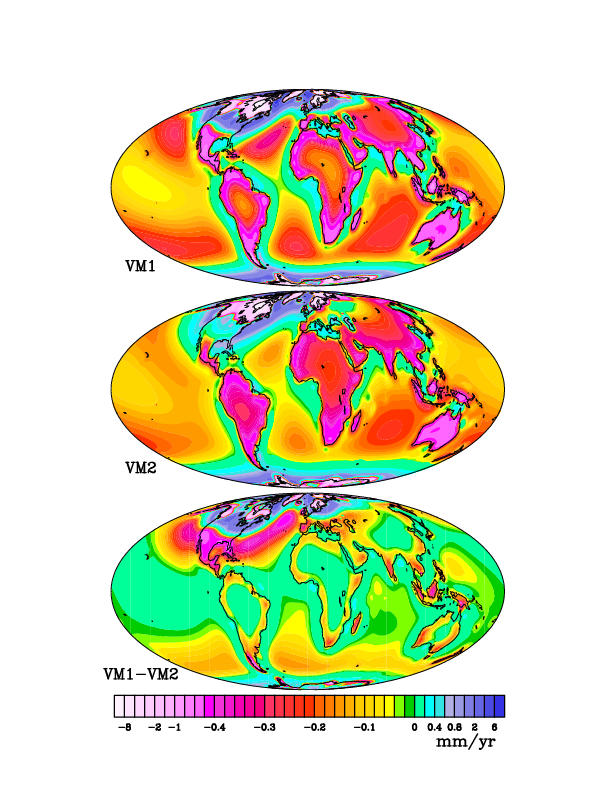
Figure 4.4. Present Day Predicted Sea Level Rise: JPG, PS
Figure 4.5. Effect of Rotation on Rate of Change of Sealevel: JPG, PS
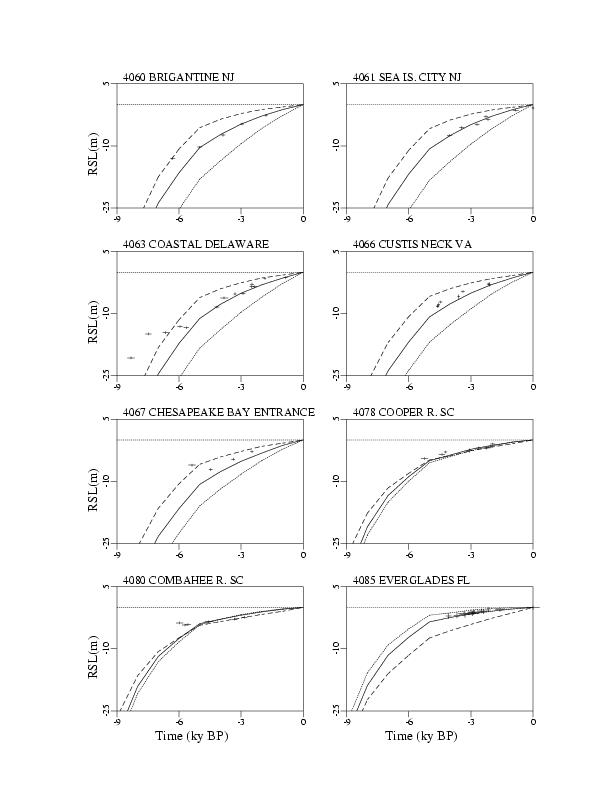
Figure 4.6. Prediction Histories of RSL Change at 16 Sites on East Coast of North America: page 1 JPG, page 2 JPG, PS
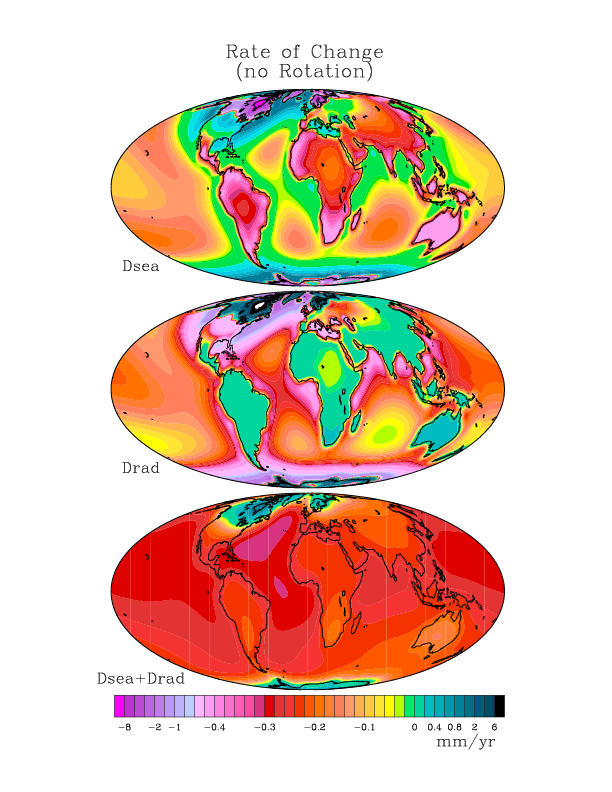
Figure 4.7. Rate of Change of Absolute Sea Level without Rotation: JPG, PS
Figure 4.8. Rate of Change of Absolute Sea Level with Rotation: JPG, PS
Figure 4.9. Rate of Change of Geoid Height: JPG, PS
Figure 4.10. Location maps for equatorial Pacific Ocean Islands from which quality-controlled RSL constraints are available: JPG, PS
Figure 4.11. Prediction Histories of RSL Change at the Island Locations Shown in Figure 4.10: page 1 JPG, page 2 JPG, PS
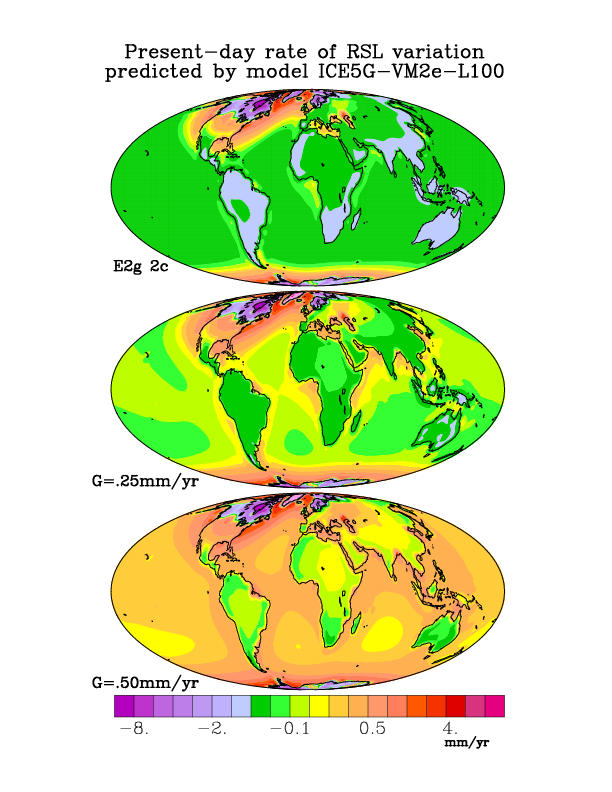
Figure 4.12. Present-day rate of RSL variation predicted by model ICE5G-VM2e-L100: JPG, PS
Special Note:
The figure titles given above are only intended to aid selection. The user should consult the actual captions give in Chapter 4 of Sea Level Rise!