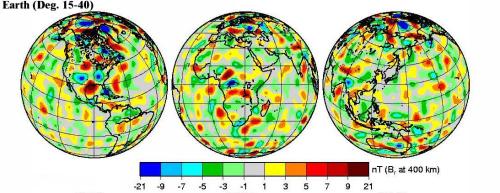
Over the past 30 years Global Magnetic
Anomaly Maps have been compiled utilizing POGO, MAGSAT and Oersted satellite magnetic field
measurements.
In spite of the fact that magnetic
data was processed differently the Major
Satellite Lithospheric Magnetic Anomalies appear to be
the same suggesting that these anomalies are real.

A model of the magnetization of the earth's crust, based on measurements
of the magnetic field made by NASA satellites Magsat, OGO-2, OGO-4, and
OGO-6. This model was also designed to be consistent with other information
on the magnetic properties of the earth's crust, such as the contrast in
magnetic properties between oceanic and continental crust. Information
on the thickness and temperature of the igneous crust is also included
in this model. Warm colors (reds) indicate the strongest magnetizations
while cool colors (blues) the weakest. Further information can be obtained
by contacting Michael
Purucker (purucker@geomag.gsfc.nasa.gov)>
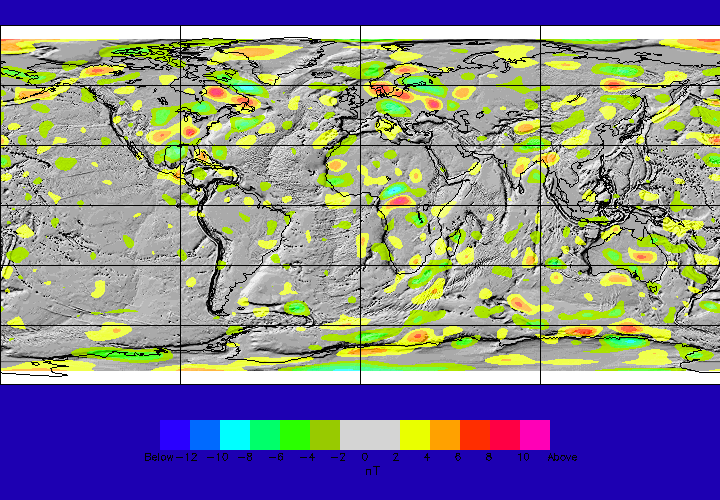
The magnetic anomalies seen on this map are caused by regional variations in the bulk magnetic properties of the earth's crust. The
observations were made by an Earth-orbiting satellite, Magsat, from late 1979 to mid 1980 at approximately 400 km altitude. The result
of an extensive sequence of processing and isolation, these vertical intensity magnetic anomalies highlight many geologic features such
as ancient shields, sedimentary basins and subduction zones. The magnetic anomalies are superimposed on topographic/bathymetric
data (gray shading).
