Latest Version uploaded (6-20-2011)

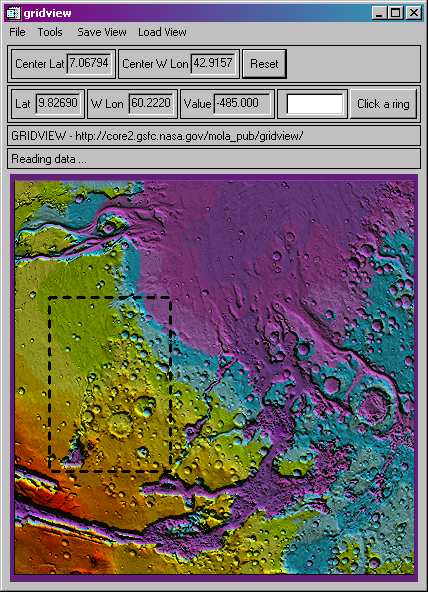
"GRIDVIEW" is an IDL program that can be used to view, measure and produce graphics of gridded data. A user-friendly, interactive menu interface provides various display and measurement options. The program is very mature, but is still under development as we add new features for data analysis and visualization. The tool can be used to view and study any gridded data, but it was specifically designed to study the gridded topographic data products of the Mars Orbiter Laser Altimeter (MOLA) instrument. GRIDVIEW has become a basic tool in the study of visible and buried basins on Mars, investigations of the dichotomy boundary, examination of the Medusa Fossae formation, calculation of sediment fill in large craters and measurement of volcano geomatry and volume.

7-2010 Updated Mac OS X setup instructions
4-07 Fixed a problem that was causing errors when reading newly created GMT/NetCDF grids.
1-07 Added the ability to load EGDR Count Grids available at http://pds-geosciences.wustl.edu/missions/mgs/megdr.html .
1-07 Changed the default program behavior to not interpolate the displayed data.
3-06 Added "Image Overlay" tool and JPEG image handling capabilities.
8-03 Added ability to modify planet dimensions for measurement accuracy
(Can measure Earth data as well as Mars)
8-03 Added many more save options
8-03 Can shade with different topography data - allows shaded topography under another colored data set which can be optionally displayed in the fly through
7-03 Added a persspective view tool with fly through capability
7-03 Improved shaded relief images (shade relief 2 tool option)
7-03 Improved acccuracy of area calculations
7-03 Space bar snaps horizontal and vertical in profile tool for easy ditance measurements
9-5-02 Added area and volume calculation tools
2-5-02 Replaced hard coded LUNs with get_lun to fix ENVI Run Time errors
11-29-01 Fixed incompatibility with IDL version 5.5 (read/write error with ring files)
11-29-01 Fixed a bug that caused crash with "0 rings error"
5-4-01 : Added a scale bar to the postscript output plots
5-4-01 : Fixed a bug in the shaded relief postscipt output files to correct the color stretches

Run the setup or install script and follow the given instructions.


Download and install the postscript viewing and printing tools called Ghostscript and GSview.

Responsible NASA official: Dr. Herbert Frey
Web Curator: Jim Roark (SSAI)
Email James.H.Roark@nasa.gov with comments or suggestions
Last modified on July 14, 2012